

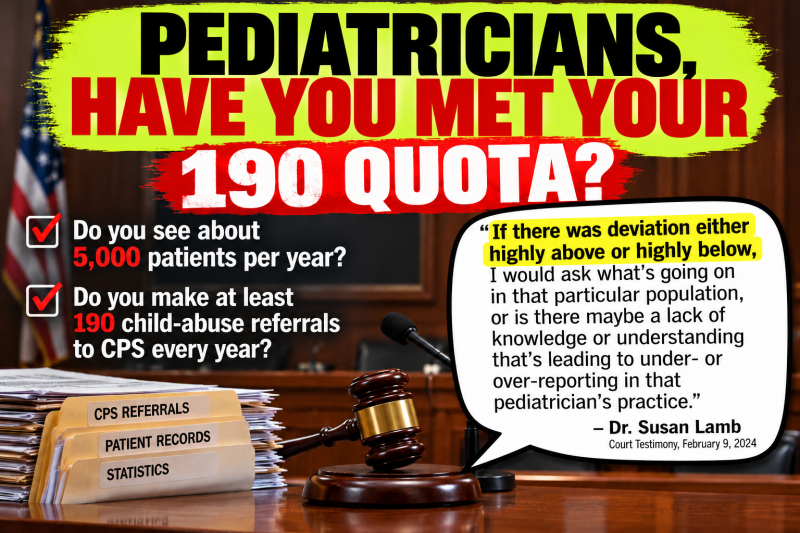
Dr. Lamb was attempting to discredit a pediatrician who had provided an opinion that contradicted her own. She testified that a pediatrician seeing approximately 5,000 patients per year should make “at least” 190 CPS referrals and suggested that substantial deviation below that number would cause her to question what was occurring in that physician’s patient population.
This was not casual conversation. It was expert testimony offered in court to discredit another physician’s credibility.
Where Did “190” Come From?
Was it Innocent Errors, or Purposeful Falsification?
Is it reasonable that the 190 figure did not cause this "expert" to think twice about what she was saying?
You decide.
The calculation deserves careful examination.
it required three material errors that are not in line with the expertise listed in the body of knowledge for Child Abuse Pediatricians. (Note 1)
Dr. Lamb's testimony appears to contain several fundamental statistical problems:
1. A percentage appears to have been erroneously used as a population reporting rate.
The figure 190, must be based on 38 per 1000. This is a glaring error. The only "38" listed in NCANDS data for Washington State, according to the source material reviewed, is a percentage of screened-in reports, not a count per 1000—not a finding that pediatricians should make 38 CPS referrals for every 1,000 patients they see.
2. Reports by medical professionals were effectively attributed to pediatricians.
The source included reports originating from numerous types of reporters. Reports from medical professionals represented only a fraction of the total. They were not all reports made by pediatricians.
3. Patient visits were treated as though they represented unique children.
A pediatrician who has 5,000 patient encounters in a year has not necessarily treated 5,000 different children. Children routinely see their pediatrician more than once.
These distinctions matter enormously when someone multiplies a statistic by 5,000 and arrives at a purported expectation of 190 child-abuse referrals per year.
Why This Testimony Matters
Dr. Lamb was not merely discussing child-abuse reporting statistics. She was using her calculation to challenge another pediatrician whose professional opinion differed from hers.
That makes the accuracy of the calculation directly relevant.
Before an expert witness suggests that another physician's referral history is unexpectedly low, one would expect the expert to verify:
-
what the underlying statistic actually measures;
-
whether it represents reports, referrals, screened-in reports, or confirmed cases;
-
whether the denominator represents individual children or patient encounters;
-
which categories of professionals made the reports; and
-
whether the statistic can legitimately be applied to one pediatrician's practice.
Mary Bridge leadership were so proud of Dr. Lamb's work they commented to protesters that they wanted “two more, just like her.”
That makes the standard being modeled, and leadership ethics particularly concerning.
The Question Pediatricians Should Be Asking
There is no established “190-referral quota” being described here. That phrase is intentionally used to illustrate the troubling implication I see in this testimony.
The real question is much more important:
Should the quality of a pediatrician's child-abuse reporting be judged by whether that physician reaches a numerical expectation—or by whether each individual report is justified by the facts, medical evidence, and circumstances of the individual child?
An expert testifying under oath should not turn population statistics into an individual physician benchmark unless the data actually support doing so.
Below is Dr. Lamb's testimony. Read it and the underlying source for yourself.
In rebuttal, after a Family Paid for Expert testified that she reported that she reports 2-5 per year, and had just reported one the prior weekend, that her numbers had been higher in prior years. Based on actual NCANDS data (not Dr. Lamb fabricated data to falsely discredited a good doctor, this is a typical number.
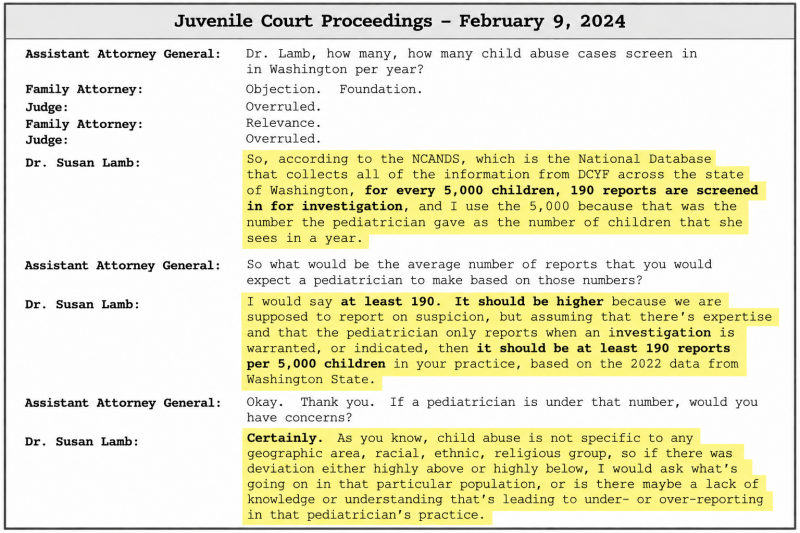
Link for 2022 NCANDS Data https://acf.gov/sites/default/files/documents/cb/cm2022.pdf
What IS a reasonable number?
It's not that hard to be precise and reasonable, in a courtroom, where your "expert" opinion carries so much weight that Judge's rely on your word to determine if a child is removed from their family. Be Ethical.
* * * * * * * * * * * * * * * * * * * * * * * * * * * * * * * * * * * * * * * * * * * * * * * * * * * * * *
First, determine what percentage of all referrals come from Pediatricians in private practice.
According to NCANDS, all medical providers represent 8-10% of all child abuse and neglect referrals, not 100% as Doctor Lamb assumed.
According to the Child Maltreatment 2022 report, published by the U.S. Department of Health & Human Services on January 29, 2024, most child abuse referrals come from professionals such as educators, law enforcement, and social services. Pediatricians and other medical professionals typically account for around 8-10% of all child abuse referrals. In contrast, educators report the highest percentage (over 20%), followed by legal and law enforcement personnel. However, pediatricians' reports often carry significant weight due to their medical expertise in identifying physical and behavioral signs of abuse. Therefore I will use 9% of referrals.
* * * * * * * * * * * * * * * * * * * * * * * * * * * * * * * * * * * * * * * * * * * * * * * * * * * * * *
Second, find a reasonable number of unique patients if a doctor is seeing 5000 patients per year, some of them are repeats from the same patients. How many actual patients would there be? A reasonable answer would be based on some data.
AAP Bright Futures Guidelines – Recommends well-child visit schedules from infancy through adolescence.
Infants (0-1 year old): Around 6-7 visits in the 1st year (newborn visits, & well-child checkups at 1, 2, 4, 6, 9, &12 mos).
Toddlers (1-3 years old): About 2-3 visits per year for well-child checkups.
Preschool and School-Age (4-10 years old): Typically 1 visit per year for an annual well-child, plus occasional sick visits.
Adolescents (11-18 years old): Usually 1 visit per year, though some may have additional visits for sports physicals, vaccinations, or health concerns.
MEPS (Agency for Healthcare Research and Quality - AHRQ) – Provides national data on healthcare visits, showing an average of 1.5 to 2 visits per year per child in pediatric settings.
Therefore 1.75 seem like a reasonable number for the average number of visits, though we should note hhat younger children have a higher frequency of referrals.
5000 appointments / 1.75 = roughly unique patients seen per year.
* * * * * * * * * * * * * * * * * * * * * * * * * * * * * * * * * * * * * * * * * * * * * * * * * * * * * *
Third, use the correct rate of 66.6 per 1000 and multiply by the correct screening in rate of 38% to get the correct amount screened in per 1000 children: 66.6 x 38% = 25.3 per 1000, not 38.
According to the Child Maltreatment 2022 report, published by the U.S. Department of Health & Human Services on January 29, 2024, most child abuse referrals come from professionals such as educators, law enforcement, and social services. Pediatricians and other medical professionals typically account for around 8-10% of all child abuse referrals. In contrast, educators report the highest percentage (over 20%), followed by legal and law enforcement personnel. However, pediatricians' reports often carry significant weight due to their medical expertise in identifying physical and behavioral signs of abuse. Therefore 9% of referrals is a reasonable percentage.
So 2857 children would generate approximately
(2.857 thousand x 25.3 per 1000 = 72.3 referrals x 9% for the estimated number for all Medical Professional: about 6.5, not 190.
and that is for all medical providers not just pediatricians. Many come from hospital ER including nurses, dentists and other medical professionals.
Assume half come from Pediatricians in Private Practice and you are now at 3-4 per year for a Pediatrician seeing 5000 patients per year.
3 to 4 per year, not 190!


Note 1: Understanding NCANDS statistics was expressly part of the American Board of Pediatrics' Body of Knowledge for Child Abuse Pediatrics. The Board specifically expected CAPs to know the NCANDS data system and the sources of its information, and to understand the strengths and weaknesses of administrative and clinical data used to determine child-abuse incidence and prevalence.